


Data Analysis: Improving Your Salla and Zid Store Performance
In the rapidly evolving world of e-commerce, merely launching an online store is no longer enough to achieve desired success. Competition is fierce, and customer expectations are constantly rising, requiring store owners to adopt smarter and more effective strategies. This is where data analysis emerges as the cornerstone for any ambitious store looking to grow and expand, whether it relies on platforms like Salla, Zid, or even Shopify. Understanding numbers and transforming them into actionable insights is what distinguishes thriving stores from those that fade into oblivion.
Imagine if you could read your customers' minds, know what attracts them, what deters them from purchasing, and which products generate the highest profit margins. Data analysis grants you this superpower, and much more. It allows you to identify your store's strengths and weaknesses, understand your visitors' behavior, measure the effectiveness of your marketing campaigns, and make decisions based on facts rather than mere guesswork. In this comprehensive article, we will delve into the world of data analysis, exploring how store owners on Salla and Zid (along with Shopify as a reference) can leverage this powerful tool to radically improve their performance and boost their profits.
In this guide, we will cover everything you need to know, starting from the importance of data analysis in e-commerce, moving through the key performance indicators (KPIs) you should track, and concluding with available tools and practical steps to effectively apply these analytics. Whether you are new to e-commerce or an experienced store owner, this article will provide valuable insights and practical tips that will help you make better marketing and operational decisions, transforming your store into an efficient and sustainable profit-generating machine.
The Importance of Data Analysis in E-commerce
Data analysis serves as the compass guiding your e-commerce ship through the turbulent seas of digital commerce. Without it, your decisions would be akin to shooting an arrow in the dark – you might hit the target or miss it entirely, but you would never truly understand the reason behind either outcome. Data provides unparalleled clarity on every aspect of your business, from customer preferences to supply chain efficiency, allowing you to optimize every step of the customer journey.
One of the most significant benefits of data analysis is its ability to uncover hidden opportunities and underlying problems. For instance, you might discover that a specific product receives many views but few sales, prompting you to investigate the cause – perhaps the price is too high, the description is unclear, or the images are unappealing. Similarly, you might find that a particular customer segment spends more than others, directing your marketing efforts to target this segment more precisely. This type of insight can only be gained by deep diving into the numbers.
Furthermore, data analysis significantly helps in improving user experience, a critical factor in boosting conversion rates. When you understand how your store visitors interact with different pages, what paths they take, and where they encounter difficulties, you can then make targeted adjustments to enhance usability and the overall browsing experience. This not only leads to increased sales but also fosters customer loyalty to your store. To learn more about this aspect, you can refer to our article on Improving User Experience: Increasing Conversion in Salla and Zid.
Key Performance Indicators (KPIs) to Track
To maximize the benefits of data analysis, you must focus on tracking the right metrics. These metrics, or Key Performance Indicators (KPIs), are quantifiable measures that reflect how successful your store is in achieving its business objectives. It's not about tracking every available number, but rather focusing on those that provide actionable insights and help you make informed decisions. Whether you use Salla, Zid, or Shopify, these indicators are fundamental to understanding your store's performance.
KPIs are typically categorized into several groups, each focusing on a specific aspect of your business. By regularly monitoring these indicators, you can gain a comprehensive picture of your store's performance and identify areas that need improvement. For example, sales metrics might reveal your best-performing products, while customer behavior metrics shed light on friction points in the purchasing path. These integrated insights are what empower you to formulate effective and targeted strategies.
It's also important to remember that KPIs are not static; their importance may change based on your current goals and business strategy. For instance, if your focus is on expansion and acquiring new customers, customer acquisition metrics might be more crucial. If your goal is to increase profitability from your existing customer base, you will focus on customer lifetime value and retention rates. Flexibility in tracking KPIs is key to success in the dynamic e-commerce environment.
Sales and Revenue Metrics
Sales and revenue metrics are the most straightforward and crucial for any e-commerce store, as they directly reflect your store's success in achieving its financial goals. Regularly tracking these indicators helps you understand product performance, identify peak sales periods, and evaluate the effectiveness of your promotional campaigns. By delving into these numbers, you can discover patterns and trends that may affect your store's long-term profitability. For example, you might notice that certain products sell well during specific seasons, allowing you to plan targeted marketing campaigns in advance.
When analyzing these metrics, simply looking at total numbers is not enough. You must dig deeper to understand what lies beneath these figures. Are sales increasing due to an increase in new customers, or due to a higher average order value from existing customers? Are certain products performing exceptionally well while others are declining? Answering these questions will give you deeper insights to help you make better marketing and operational decisions, such as identifying products that warrant more investment or those that need a re-evaluation of their pricing strategy. You can benefit from our article on Product Pricing: Smart Strategies for Salla and Zid Stores to improve this aspect.
By carefully monitoring sales and revenue metrics, you can also detect potential problems early. For example, a sudden drop in average order value might indicate that your cross-selling and upselling strategies are not working effectively, or that there's an issue with product bundling. This allows you to intervene quickly to correct the course before the problem escalates and significantly impacts your profits. Data is your eye on your store.
- Total Revenue: The total amount of money your store has generated from sales.
- Average Order Value (AOV): The average amount a customer spends per purchase.
- Month-over-Month/Year-over-Year Growth: The percentage increase or decrease in revenue compared to previous periods.
- Gross Profit Margin: The percentage of revenue remaining after deducting the cost of goods sold.
- Best-Selling Products: Products that generate the highest sales.
Customer Behavior Metrics
Customer behavior metrics are vital for understanding how your visitors interact with your store and what drives them toward or deters them from purchasing. These metrics go beyond mere financial figures to reveal the psychological and interactive aspects of the customer journey. By analyzing this data, you can optimize your store's design, navigation flows, and even content strategies to create a more engaging and effective experience. Understanding customer behavior is key to building a store that better meets their needs and expectations.
For example, a high bounce rate might indicate that the landing page does not match visitors' expectations or that the page load time is too long. If the add-to-cart rate is high but the conversion rate is low, there might be an issue with the checkout process or shipping costs. Analyzing these scenarios allows you to identify friction points in the customer journey and make necessary adjustments to streamline the process and increase purchase opportunities. This helps you build strong relationships with your customers.
Tracking customer behavior metrics also helps you understand customer loyalty and their long-term value. For instance, customers who return for repeat purchases are the most valuable to your store. You can analyze their behavior to understand what distinguishes them and how you can attract more similar customers. These insights enable you to personalize offers and recommendations, increasing customer satisfaction and boosting Customer Lifetime Value (CLTV). Inventory Management: Improving Efficiency in Salla and Zid can play a role in influencing customer behavior and satisfaction.
- Bounce Rate: The percentage of visitors who leave your store after visiting only one page.
- Average Session Duration: The average time visitors spend in your store.
- Pages per Session: The average number of pages a visitor views per session.
- Add-to-Cart Rate: The percentage of visitors who add products to their shopping cart.
- Cart Abandonment Rate: The percentage of customers who add products to their shopping cart but leave without completing the purchase.
Marketing and Conversion Metrics
Marketing and conversion metrics are essential for measuring the effectiveness of your marketing campaigns and understanding your store's ability to convert visitors into paying customers. These metrics are not limited to just knowing how many visitors come to your store but extend to include how they perform after arrival, where they came from, and the costs associated with acquiring them. Understanding these numbers allows you to optimize your marketing budget, direct your efforts toward the most profitable channels, and achieve a higher return on investment.
When analyzing these metrics, you can identify the marketing channels that perform best, whether they are paid advertising campaigns, social media marketing, or search engine optimization (SEO). For example, if the conversion rate from Facebook ads is significantly higher than Google ads, you might decide to reallocate your marketing budget to increase spending on Facebook. This type of analysis helps you make data-driven decisions to maximize the effectiveness of your marketing campaigns and reduce wasted spending.
Tracking Customer Acquisition Cost (CAC) and Customer Lifetime Value (CLTV) also gives you a comprehensive view of the profitability of your marketing strategies. If the cost of acquiring a customer exceeds their long-term value, it indicates a problem with your marketing or pricing strategy. Your goal should always be to lower CAC and increase CLTV to ensure the sustainable growth of your store. Platforms like Salla, Zid, and Shopify provide tools to help you track these essential metrics.
- Conversion Rate: The percentage of visitors who complete a purchase.
- Customer Acquisition Cost (CAC): The average cost of acquiring a new customer.
- Customer Lifetime Value (CLTV): The total expected revenue from a customer over the duration of their relationship with your store.
- Return on Ad Spend (ROAS): The amount of revenue generated for every dollar spent on advertising.
- Traffic Sources: The channels from which visitors come (e.g., organic search, paid, social media, email).
Available Data Analysis Tools in Salla, Zid, and Shopify
Fortunately, data analysis does not require you to be a data science expert. E-commerce platforms like Salla, Zid, and Shopify offer a suite of built-in tools that greatly simplify this process, in addition to the ability to integrate with more advanced external analytics tools. These tools are designed to help you collect, organize, and present data in easy-to-understand reports and charts, allowing you to focus on making decisions rather than spending time manually compiling numbers. The choice between these platforms depends on your store's needs, and you can compare them in the article Salla, Zid, and Shopify: Which is Best for Your Store?.
Analytical capabilities vary from one platform to another, but the common denominator is providing essential insights into sales, customers, and products. For example, a platform might offer you a detailed report on best-selling products or the most effective traffic sources. These initial reports are an excellent starting point for any store owner, enabling them to get a quick overview of their store's performance without complex configuration. However, for deeper analysis and more detailed insights, you might need to use external tools.
It is very important to invest time in familiarizing yourself with the interfaces and analytical tools provided by the platform you use. The more proficient you become with these tools, the more valuable information you can extract from your store's data. Do not hesitate to explore every section, experiment with different filters, and customize reports to suit your needs. Making the most of these tools is the first step towards transforming data into smart business decisions.
Built-in Analytics Tools
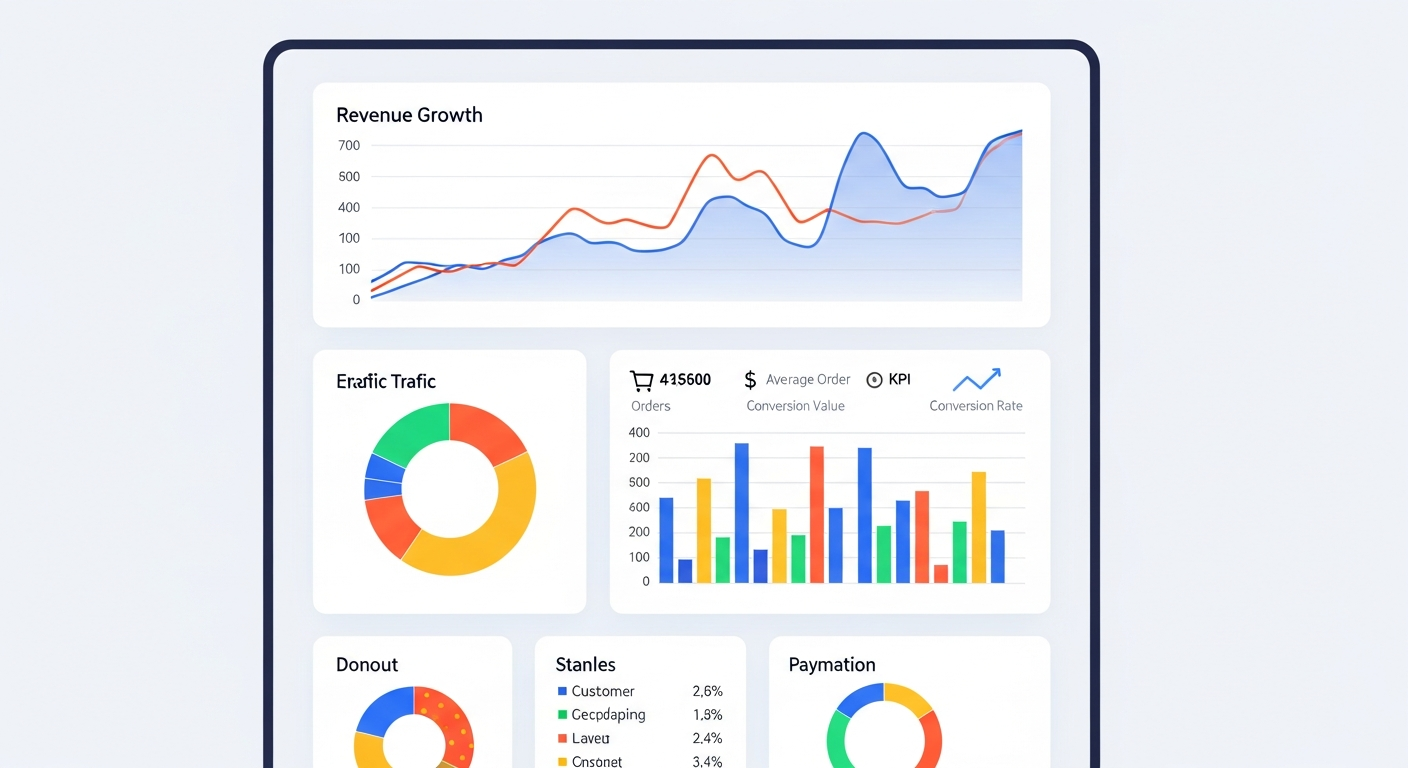
Platforms like Salla, Zid, and Shopify provide built-in analytics dashboards as part of your subscription, specifically designed to help store owners track basic performance easily and conveniently. On Salla, you can access the "Reports" section, which gives you an overview of sales, orders, customers, and best-selling products. It also provides detailed reports on traffic sources and order statuses, helping you understand where your efforts are concentrated and their effectiveness. These reports are sufficient for small and medium-sized stores to gain initial insights.
Zid, in turn, offers an "Analytics" dashboard that displays comprehensive data on daily sales, average order value, visitor count, and most popular products. It also provides reports on marketing campaign performance, helping you measure the return on investment from your various advertisements. Zid is characterized by providing detailed data on shopper behavior within the store, such as products viewed but not purchased, which offers opportunities to improve user experience and stimulate purchases.
Shopify, on the other hand, boasts a very powerful and flexible analytics system, offering a wide range of customizable reports on sales, customers, products, traffic, and even shopping behavior. You can track everything from conversion rates by device to the performance of coupons and discounts. Additionally, Shopify provides the ability to create custom reports using multiple filters, allowing you to deep dive into the data and explore any aspect of your store you wish.
External Analytics Tools
While built-in tools provide a good foundation, external analytics tools open up broader horizons for deeper and more specialized data analysis. These tools can be easily integrated with most e-commerce platforms like Salla, Zid, and Shopify, offering advanced analytical capabilities not typically available in built-in tools. Using these tools can give you a significant competitive advantage by providing more detailed and accurate insights into your store's performance and customer behavior.
Google Analytics (GA4) is the most powerful and popular tool for analyzing website traffic and user behavior. It can be easily connected to your Salla, Zid, or Shopify store and provides endless data on traffic sources, most visited pages, customer paths, and conversion rates. Understanding how to effectively use Google Analytics will completely change how you view your store's performance and empower you to optimize every aspect of the user experience.
In addition to Google Analytics, many other specialized tools can complement your analytics. For example, heatmap tools like Hotjar or Crazy Egg allow you to see where visitors click, where they scroll, and what parts of your pages they focus on. These visual insights are invaluable for optimizing page design and call-to-action button placements. Also, A/B testing tools like Optimizely or VWO can be used to experiment with different versions of pages or elements and determine which performs best.
- Google Analytics (GA4): A comprehensive analytics tool for traffic and user behavior.
- Hotjar/Crazy Egg: Heatmap and session recording tools to visually understand user interaction.
- Facebook Pixel/TikTok Pixel: Tracking tools to collect data on user behavior from your advertising campaigns on these platforms.
- Microsoft Clarity: A free tool offering heatmaps, session recordings, and user behavior analytics.
- SEMrush/Ahrefs: Tools for competitor analysis, keyword research, and overall SEO performance.
Practical Steps for Applying Data Analysis to Improve Your Store
Now that we've covered the importance of data analysis, KPIs, and available tools, it's time to put this knowledge into action. Applying data analysis is not a one-time process but an ongoing cycle of planning, collection, analysis, implementation, and monitoring. By following these practical steps, you can build a robust system for continuously improving your store's performance, regardless of whether you use Salla, Zid, or Shopify as your primary platform. This cycle is what distinguishes successful stores from others.
This process requires a commitment to learning and adaptation, as the e-commerce environment is constantly changing. What was effective yesterday might not be today, so you must be prepared to experiment with new strategies based on the insights data provides. Remember, the goal is not just to collect data, but to transform it into actionable decisions that lead to tangible results. The more skilled you become in this cycle, the greater your ability to compete and achieve sustainable growth in the market.
It is also crucial to involve your team in this process, if you have one. Everyone understanding the importance of data and how to use it will create a data-driven culture within your business, fostering collaboration and increasing the effectiveness of improvement efforts. Training your team to read basic reports and identify opportunities can make a significant difference in your speed of response to market changes and collectively improve your store's performance.
Define Goals and Collect Data
The first and most critical step is to define clear and measurable goals for your store. What do you want to achieve? Is it to increase sales by a certain percentage? Improve the conversion rate? Reduce the cart abandonment rate? Each goal should be specific, realistic, and time-bound. These goals will guide the data collection process and determine the key performance indicators you need to track. Without clear goals, you will find yourself lost in a sea of data with no clear direction.
After defining your goals, it's time to collect data. Ensure that your analytics tools (whether built into Salla/Zid/Shopify or external like Google Analytics) are set up correctly and functioning efficiently to collect all relevant data. Regularly verify that tracking is working properly and that events (such as adding to cart or completing a purchase) are accurately recorded. Remember that the quality of your decisions directly depends on the quality of the data you collect. Inaccurate or incomplete data will lead to misleading insights and incorrect decisions.
It's also important to consider the types of data you need to achieve your goals. Is it behavioral data (like user clicks)? Or demographic data (like customer age and location)? Or transactional data (like average order value)? Each type of data offers different insights and can be crucial for achieving a specific goal. For example, if your goal is to increase sales for a particular product, you will need data on product views, its add-to-cart rate, its conversion rate, in addition to pricing and profitability data.
Analyze and Interpret Data
Once the data is collected, the most exciting phase begins: analyzing and interpreting it. This step requires you to delve into reports and charts to look for patterns, trends, and relationships between numbers. Don't just look at superficial figures; try to understand what these numbers mean in the context of your business. Ask yourself questions like: Why did this happen? What influenced this number? Is there a relationship between an increase in this metric and a decrease in another?
Utilize the filtering and segmentation features available in your analytics tools. For example, you can segment visitors by traffic source (ads, organic search, social media), by device used (mobile, desktop), or even by geographical location. This segmentation will help you uncover subtle differences in customer behavior and the performance of various channels. You might find that a particular marketing campaign performs well on mobile but poorly on desktop, guiding you to adjust your strategy.
Don't be afraid to form hypotheses and test them. For instance, if you notice a high cart abandonment rate, you might hypothesize that shipping costs are the cause. You can then make an adjustment to your shipping policy (or offer free shipping) and monitor whether the abandonment rate decreases. This is the nature of data-driven analysis: identify the problem, form a hypothesis, test it, and measure the results. Remember that analysis is not just about reading numbers; it's a continuous process of inference and experimentation.
Take Action and Monitor Results
The final, and most crucial, step is to translate data insights into practical actions. There is no benefit in analyzing data if it is not used to improve your store. Based on what you've learned from the analysis, develop a clear action plan that includes specific steps, responsibilities, and timelines. For example, if you discovered that a particular product description is unclear and affects sales, the action might be to rewrite the description and add high-quality images. Every action should be based on evidence from the data.
After implementing the actions, don't stop there. You must continuously monitor the results to measure the impact of the changes you've made. Have the key performance indicators you were targeting improved? Did the changes lead to increased sales or improved customer experience? You may need to make additional adjustments based on these observations. This continuous cycle of improvement is the essence of a data-driven work culture, ensuring that your store constantly evolves to meet market and customer demands.
Remember that success in e-commerce is not a one-time event but a continuous journey of learning, adaptation, and improvement. Data analysis provides you with the necessary tools to guide this journey intelligently and effectively. Whether you use Salla, Zid, or Shopify, a commitment to data analysis will set your store on the right path towards sustainable growth and achieving desired profits. Don't let data accumulate without leveraging it; it's a treasure waiting to be discovered.
Conclusion
In conclusion, the importance of data analysis in today's e-commerce world cannot be overstated. This approach has become not just an option, but an imperative for any online store aspiring to survive and thrive in a highly competitive market. Through a deep understanding of key performance indicators, leveraging the tools available on platforms like Salla, Zid, and Shopify, and applying practical, systematic steps, store owners can transform raw numbers into strategic insights that drive growth and profitability.
The journey of improving your store's performance through data analysis is a continuous one that doesn't stop at a certain point. It requires curiosity to investigate, courage to experiment, and a commitment to learning from every experience. Every sale, every page visit, every click, carries valuable information waiting to be discovered and wisely utilized. Make data analysis an integral part of your operational culture, and you will see how your store transforms from a mere product selling platform into a smart business machine capable of adapting to any challenge.
Therefore, don't wait any longer. Start today by tracking your key metrics, exploring the available reports in your store's dashboard, and integrating external analytics tools if necessary. Begin with small steps and monitor the results, then gradually expand the scope of your analyses. Remember that data is your secret language for communicating with your customers and understanding their true needs, and it is your key to unlocking continuous success in the world of e-commerce.