




The Importance of Store Analytics in the E-commerce Era
In the rapidly evolving digital landscape of e-commerce, success is no longer merely a matter of luck or good products; it increasingly relies on the ability to understand data and transform it into smart strategic decisions. Store analytics serves as the compass guiding store owners toward sustainable growth and increasing profitability, providing deep and comprehensive insights into store performance, customer behavior, and the effectiveness of marketing campaigns. Without these analytics, merchants grope in the dark, relying on guesswork and intuition, which exposes their investments to risk in a highly competitive market.
Store analytics is the vital lifeline for any e-commerce business aspiring for growth and expansion. It's not just complex numbers and charts; it's the stories told by your customer and product data. By understanding these stories, you can identify strengths to leverage, weaknesses to address, and hidden opportunities to exploit. Platforms like Salla, Zid, and Shopify offer robust analytical tools that help merchants collect and interpret this data, paving the way for informed decisions that significantly improve customer experience and boost sales.
In today's world, where the number of online stores is increasing daily, differentiation becomes crucial. Differentiation only comes through a deep understanding of what customers want, how they interact with your store, and which products are popular or need re-evaluation. This understanding cannot be achieved without delving into the data generated by every purchase, every click, and every visit. It is the ability to transform raw data into actionable insights that separates successful stores from those struggling to survive.
Transforming Raw Data into Actionable Insights
The true power of analytics lies in its ability to transform vast amounts of raw, unstructured data into valuable, clear information that any store owner can use to guide their business. For instance, data might show that a significant percentage of visitors browse products but don't complete a purchase, indicating a problem with the shopping cart or checkout process. Without this data-driven insight, the merchant might blame low traffic or product quality, while the real issue lies elsewhere entirely.
The process of transforming data into actionable insights requires more than just displaying numbers on a dashboard. It demands a contextual understanding of the data and the ability to connect different metrics to form a complete picture. For example, if the conversion rate is low, one must investigate traffic sources, bounce rate, time spent on the page, and user behavior within the store to understand the reasons for this decline. This holistic view enables merchants to formulate effective and targeted strategies, rather than relying on costly trial and error.
The challenge of transforming data into insights lies in not falling into the trap of over-analysis or paralysis by information overload. Store owners should focus on key metrics that directly impact their business goals and prioritize actions based on their anticipated impact. This focus helps avoid wasting time and resources analyzing irrelevant data, ensuring that every analytical effort leads to a tangible outcome. The ultimate goal is not just to collect data, but to use it to achieve sustainable and profitable growth for your online store.
Key Performance Indicators (KPIs) to Track
To maximize the benefits of store analytics, store owners must identify and regularly track a set of Key Performance Indicators (KPIs). These indicators provide a quantitative measure of the store's performance across various aspects and help evaluate the effectiveness of implemented strategies. Choosing the right KPIs depends on specific store goals, but there is a core set of indicators considered vital for any e-commerce store aiming for continuous growth and improvement. These indicators cover areas such as sales, customer behavior, and marketing.
Key Performance Indicators serve as the dashboard that gives you a comprehensive and immediate view of your online store's health. They allow you to move beyond simply observing numbers to truly understanding what those numbers mean for your business. For example, knowing total revenue is good, but understanding average order value and conversion rate gives you deeper insights into the efficiency of your sales operations. Therefore, a store owner must be fully aware of these indicators and how they influence each other to achieve maximum efficiency.
Continuously tracking these indicators helps uncover long-term trends and patterns, enabling you to predict future changes and prepare for them proactively. For example, if you notice a continuous decrease in average order value, you can then consider cross-selling or upselling strategies to increase this metric. Also, comparing your current performance with historical data or industry benchmarks can reveal significant improvement opportunities. You can refer to Optimizing Products: SEO for Your Salla and Zid Store to understand how product optimization can positively impact these metrics.
Sales and Revenue Performance Indicators
Sales and revenue performance indicators are among the most critical metrics for any e-commerce store, as they directly measure the store's success in achieving its financial objectives. Tracking these indicators helps understand sales volume, sales process efficiency, and overall profitability. Understanding these metrics allows you to make informed decisions regarding pricing strategies, promotional offers, and even identifying products that deserve more investment or those that require a comprehensive review.
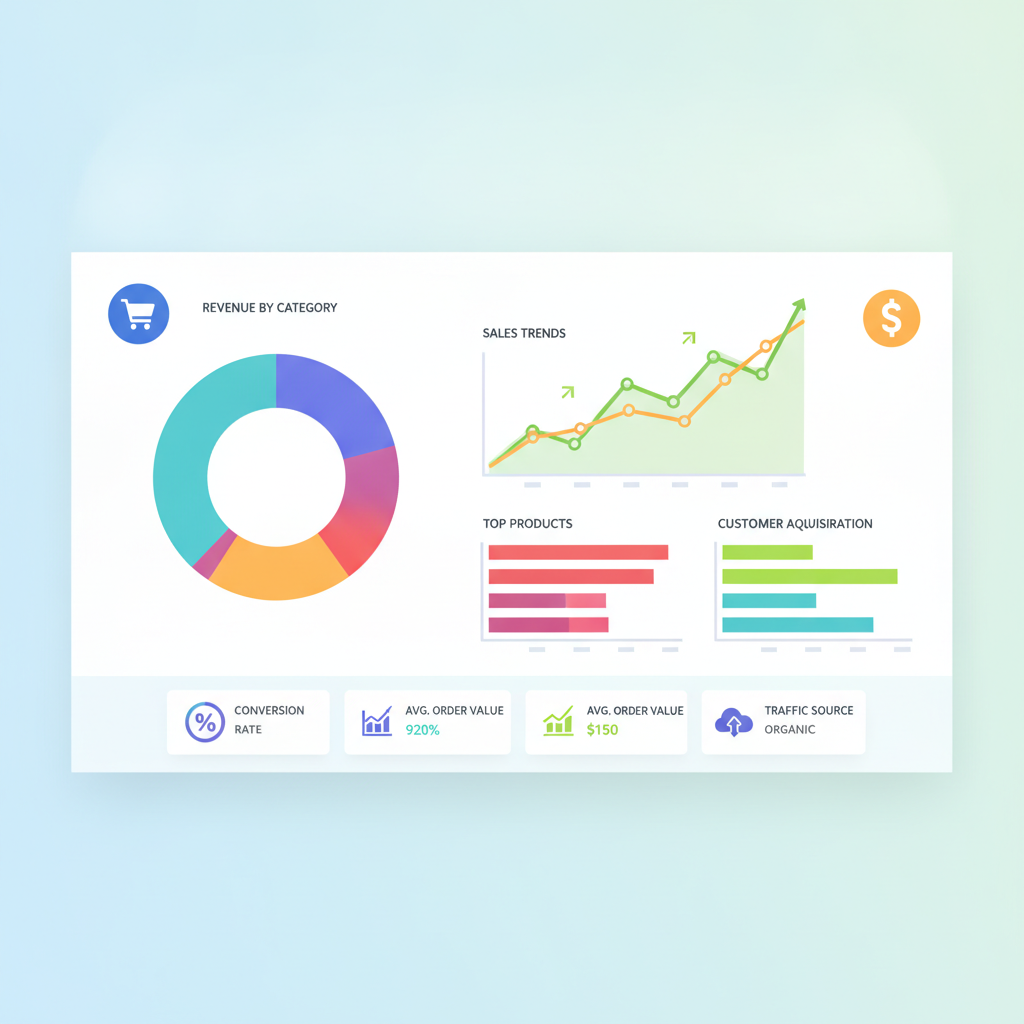
Among the most prominent of these indicators is Net Sales Revenue, which reflects actual revenue after deducting returns and cancellations. Additionally, Average Order Value (AOV) is a vital indicator, showing the average amount a customer spends per purchase; increasing it means higher revenue without needing to increase customer numbers. The Conversion Rate, which measures the percentage of visitors who complete a purchase out of total visitors, is a fundamental metric for your store's effectiveness and its ability to convert interested parties into actual buyers.
Focus should also be placed on metrics such as the Cart Abandonment Rate, which reveals the percentage of shoppers who add products to their cart but leave the store without completing the purchase. This indicator is crucial for identifying potential issues in the checkout process or user experience. Furthermore, the Gross Profit Margin provides insight into the profitability of each sale after deducting the cost of goods sold, which is essential for ensuring long-term business sustainability.
- Net Sales Revenue: Total actual revenue after deducting returns and cancellations.
- Average Order Value (AOV): The average amount a customer spends per purchase.
- Conversion Rate: The percentage of visitors who complete a purchase out of total visitors.
- Cart Abandonment Rate: The percentage of shoppers who add products to the cart and then leave.
- Gross Profit Margin: The percentage of profit made from sales after deducting the cost of goods sold.
Customer and Behavior Performance Indicators
The success of an online store is not limited to achieving initial sales; it extends to building a loyal and engaged customer base. Customer and behavior performance indicators provide valuable insights into how customers interact with your store, their loyalty, and their potential for repeat purchases. Understanding these metrics helps improve customer retention strategies, personalize experiences, and build long-term relationships with them, contributing to long-term revenue growth and reducing the cost of acquiring new customers.
A key indicator in this aspect is Customer Acquisition Cost (CAC), which measures the average cost required to bring in a new customer. Knowing this figure helps evaluate the effectiveness of marketing campaigns and determine if acquisition strategies are profitable. Also, Customer Lifetime Value (CLV), which predicts the total revenue expected from a customer throughout their relationship with the store, is a crucial indicator for assessing the true value of each customer and guiding retention strategies.
Additionally, Repeat Purchase Rate and Customer Retention Rate should be tracked, as they indicate how successful the store is in encouraging customers to return and make further purchases, and remain as loyal customers. These indicators reflect not only customer loyalty but also product quality and customer service. Understanding customer behaviors through these metrics allows you to personalize offers, identify the most valuable customer segments, and design effective loyalty programs that increase their connection to your store.
- Customer Acquisition Cost (CAC): The average cost to acquire a new customer.
- Customer Lifetime Value (CLV): The total expected revenue from a customer over the long term.
- Repeat Purchase Rate: The percentage of customers who have purchased more than once.
- Customer Retention Rate: The percentage of customers who continued to purchase during a specific period.
- Bounce Rate: The percentage of visitors who leave after visiting only one page.
Marketing and Campaign Performance Indicators
Marketing and campaign performance indicators are essential for evaluating the effectiveness of your marketing efforts and identifying channels that yield the best return on investment. In the world of e-commerce, where marketing channels and strategies are diverse, it becomes crucial to accurately measure the impact of each campaign to ensure that the marketing budget is utilized with maximum efficiency. These indicators help you understand where your customers come from, how they interact with your marketing messages, and the actual cost of attracting them.
Among the most important of these indicators is Traffic Sources, which shows the channels from which your store attracts visitors (e.g., organic search, paid ads, social media, email). Understanding these sources helps guide your marketing strategies and allocate budgets to the most effective channels. Also, Click-Through Rate (CTR), which measures the attractiveness of your ads or links, and Cost-Per-Click (CPC) are crucial indicators for evaluating the performance of paid advertising campaigns.
It is impossible to overlook Return on Ad Spend (ROAS), which measures the revenue generated for every riyal spent on ads, making it a direct measure of your advertising campaigns' profitability. Additionally, tracking Email Open Rate and Email Click-Through Rate is essential for evaluating the effectiveness of email marketing campaigns. You can benefit from Email Marketing: Boosting Sales for Your Salla and Zid Store to improve these metrics and get the most out of your campaigns.
- Traffic Sources: The channels from which your store attracts visitors.
- Click-Through Rate (CTR): The ratio of clicks to impressions for an ad or link.
- Cost-Per-Click (CPC): The cost you pay for each click on your ads.
- Return on Ad Spend (ROAS): Revenue generated for every unit of currency spent on ads.
- Email Open Rate: The percentage of opened emails.
Leveraging Built-in Analytics Tools in Salla, Zid, and Shopify
Leading e-commerce platforms like Salla, Zid, and Shopify offer built-in analytics tools that help merchants track and understand their store's performance without the need for complex external tools initially. These tools are designed to be user-friendly and provide essential insights that any store owner can use to make better decisions. Leveraging these integrated analytical capabilities is the first and fundamental step towards building a data-driven strategy, ensuring that you manage your store not based on guesswork, but on tangible facts and figures.
Each of these platforms features unique strengths in providing analytics, tailored to meet the needs of different types of merchants and store sizes. While one platform might focus on easy access to basic data, another might offer more detailed tools for deep analysis and customer behavior. The common goal is to empower merchants to monitor their store's performance, identify best-selling products, understand traffic sources, and track the customer journey from browsing to completing a purchase, all through a single, unified dashboard.
Understanding how to navigate these built-in analytical tools and extract maximum value from them is key to success. It's not enough to merely glance at the numbers; you must dedicate regular time to delve into reports, compare data across different time periods, and identify trends. This proactive approach to analysis enables you to spot potential problems early and capitalize on new opportunities as they arise, giving your store a significant competitive edge in the market.
Dashboards and Reports in Salla
Salla is known for being user-friendly and specifically tailored for stores in the Arab region, offering an intuitive dashboard with a dedicated section for reports and analytics. Salla store owners can easily access vital information about sales, orders, customers, and products. These reports are designed to be clear and straightforward, making it easy for merchants, even beginners, to understand their store's performance without needing in-depth analytical background, making it an excellent starting point in their digital transformation journey.
Salla's reports typically include an overview of daily, weekly, and monthly revenues, in addition to details about best-selling products, pending orders, and completed orders. Salla also provides reports on the most active customers, which helps identify high-value customers and design retention strategies. These basic reports are sufficient to enable a merchant to monitor their store's health, identify top-performing products, and understand when most sales occur to adapt marketing campaigns accordingly.
Despite their simplicity, Salla's analytics provide a solid foundation for making daily decisions. For example, through them, a merchant can identify peak sales times, helping schedule new product launches or promotional campaigns. They can also identify products that are not gaining much traction and decide whether to liquidate them or improve their descriptions and images. These basic analytical capabilities make Salla a powerful platform for small and medium-sized store owners looking for a comprehensive and easy solution to efficiently manage their digital businesses.
Comprehensive Growth Analytics in Zid
Zid platform stands out for its focus on growth and empowering merchants to scale, offering a more comprehensive and detailed set of analytical tools compared to some other platforms. Zid's analytics are designed to provide store owners with deeper insights into the customer journey, product performance, and marketing campaign effectiveness, helping them identify new growth opportunities and continuously refine their strategies. This focus on advanced data makes Zid an excellent choice for stores seeking rapid and sustainable growth.
Zid's analytics go beyond basic reports to offer detailed insights into customer behavior, such as bounce rates from different product pages, the path a customer takes before completing a purchase, and even products that are frequently viewed together. This precise data helps merchants improve user experience, personalize product recommendations, and identify bottlenecks in the purchase funnel. Zid also provides detailed reports on traffic sources, allowing merchants to understand which marketing channels yield the best return and allocate their budgets more effectively.
Through Zid's analytics, store owners can conduct in-depth analysis of product performance, including best-selling products, those with the highest profit margins, and even products that are not selling at all. This analysis enables merchants to optimize their product assortment, efficiently manage inventory, and strategically plan promotional offers. The ability to track key performance indicators clearly and in detail makes Zid a powerful tool for any store looking to make data-driven decisions to maximize growth and profitability.
Advanced Analytical Capabilities of Shopify
Shopify is recognized as a leading global platform and provides a robust suite of built-in analytics tools that can be significantly expanded through its app store. Shopify's basic reports cover vital aspects such as sales, revenue, customer behavior, and traffic sources, giving merchants a comprehensive overview of their store's performance. These tools are designed to support stores of all sizes, from small startups to large enterprises, making it a flexible choice for store owners worldwide.
Shopify's advanced reports include real-time visitor behavior analysis, details on most viewed and most added-to-cart products, as well as detailed reports on customer lifetime value and retention rates. This data helps merchants understand purchasing patterns, identify their most loyal customers, and tailor marketing and customer retention strategies effectively. Shopify also provides tools for analyzing marketing campaign performance, allowing for accurate evaluation of the return on investment for each marketing channel.
Beyond the built-in reports, Shopify's app store opens the door to a wide range of specialized third-party analytics tools that can be easily integrated to enhance analytical capabilities. Whether you need in-depth user behavior analytics, advanced A/B testing tools, or custom solutions for inventory management based on forecasts, Shopify offers the flexibility to choose the exact tools that fit your needs. This flexibility makes Shopify a powerful platform for merchants who want to build a sophisticated and scalable analytical strategy.
Using Analytics for Smart Business Decisions
The ultimate goal of collecting and analyzing data is not merely to possess information, but to use this information to make smart, informed business decisions that drive the store toward success. Analytics provides you with the necessary insights to optimize every aspect of your business, from user experience to inventory management, including pricing and marketing strategies. The transition from guesswork to certainty, from intuition-based decisions to evidence-backed ones, is what distinguishes leading e-commerce stores in the market.
Analytics enables you to identify hidden problems that might hinder your store's growth and reveals opportunities you wouldn't have noticed otherwise. For example, data might show that most purchases are made through mobile devices, prompting you to optimize your store's design and user experience for smartphones. Or you might notice that a particular product is very popular but not generating enough profit, necessitating a review of its pricing strategy. These data-driven decisions create a real competitive advantage.
In the fast-changing world of e-commerce, making good decisions once is not enough. It requires a continuous process of monitoring, analyzing, and adapting. Analytics should be an integral part of your daily or weekly routine, allowing you to respond quickly to changes in consumer behavior or market trends. The faster you understand and act on data, the greater your store's chances of achieving sustainable success and growth in this accelerating field.
Optimizing User Experience and Conversion Rate
User Experience (UX) and Conversion Rate are among the most critical factors determining the success of any online store. Analytics helps uncover obstacles visitors face in their journey within the store, preventing them from completing a purchase. By monitoring user behavior, such as the pages they visit, the time they spend on each page, and common exit points, store owners can identify areas that need improvement to convert more visitors into actual customers. This deep understanding enables you to design a seamless and enjoyable shopping experience.
Using analytics, you can identify pages with high bounce rates or pages where customers abandon their shopping carts. These issues might stem from slow page loading, unclear design, or a complicated checkout process. By addressing these problems based on data, friction in the customer journey can be reduced, and the conversion rate significantly improved. Improvements might include adjusting page layout, simplifying checkout steps, or enhancing store loading speed to ensure an optimal user experience.
Furthermore, analytics enables A/B testing on various store elements, such as Call-to-Action buttons, product images, or even product descriptions. By comparing the performance of two different versions, the element that generates the best visitor response can be identified, thereby boosting the conversion rate. This continuous, data-driven optimization process ensures that your store constantly evolves to meet customer expectations and increases direct sales opportunities.
Pricing Strategies and Identifying Profitable Products
Pricing strategies and identifying profitable products are crucial decisions that directly impact a store's profitability. Analytics provides valuable data that helps make these decisions intelligently. By analyzing sales data, you can identify best-selling products and those with the highest profit margins, as well as products that are not very popular or incurring losses. This understanding enables you to optimize your product assortment and direct your efforts towards what yields the best return.
Analytics allows you to monitor the performance of individual products, including views, add-to-cart numbers, and conversion rates for each product. This information helps identify products that need improvement in description or images, or those whose prices may not be competitive. Data can also be used to identify cross-selling and upselling opportunities by displaying related products or higher-value products to customers based on their purchase history or browsing, thus increasing the average order value.
Additionally, analytics can be used to evaluate the effectiveness of promotions and discounts. By tracking the impact of coupons and offers on sales and profit margins, store owners can identify the most successful promotional strategies and replicate them in the future. For example, you can analyze data to see which coupons generate the best response and which products benefit most from offers. You can leverage Building Loyalty: Using Smart Coupons in Salla and Zid to develop more effective pricing and offer strategies.
Optimizing Marketing Campaigns and Customer Targeting
Analytics is an indispensable tool for optimizing marketing campaigns and ensuring your message reaches the right audience at the right time. By tracking the performance of various marketing channels, store owners can identify which channels yield the best Return on Investment (ROI) and which need adjustment or elimination. This deep understanding of traffic sources and the behavior of customers coming from each channel helps allocate marketing budgets more effectively.
Analytics enables customer segmentation based on their behaviors, preferences, and purchase history. This segmentation allows for targeted and personalized marketing campaigns for each segment, increasing engagement and conversion opportunities. For example, special offers can be sent to customers who haven't purchased in a while, or new products can be recommended to customers who have previously bought similar items. This personalized approach enhances customer loyalty and increases the effectiveness of marketing campaigns.
Furthermore, analytics helps evaluate the effectiveness of paid advertisements by tracking metrics such as Click-Through Rate (CTR), Cost-Per-Click (CPC), and Return on Ad Spend (ROAS). Through this data, store owners can refine ad targeting, adjust ad content, and optimize landing pages to ensure maximum return for every riyal spent on marketing. The ability to continuously analyze campaign performance and adjust based on data is key to success in the competitive world of digital marketing.
Efficient Inventory and Supply Chain Management
Inventory and supply chain management are vital aspects of any e-commerce store's success, and analytics plays a pivotal role in achieving efficiency in this area. By analyzing historical sales data and seasonal patterns, store owners can more accurately forecast future product demand. This accurate forecasting helps avoid issues such as out-of-stock situations, which lead to lost sales, or overstocking, which ties up capital and increases storage costs. You can refer to E-commerce Store Cost: Salla, Zid, and Shopify Comparison for a deeper understanding of operational costs affected by inventory management.
Analytics enables the identification of slow-moving products and those that sell out quickly. This information is essential for making informed decisions regarding reordering or liquidating undesirable products through promotions. It also helps optimize product arrangement in warehouses to ensure fast packing and shipping, which reduces order fulfillment time and generally improves the customer experience. Efficient inventory management not only cuts costs but also increases customer satisfaction by providing desired products in a timely manner.
Moreover, analytics can be used to evaluate the performance of suppliers and shipping companies. By tracking delivery times, error rates, and the quality of received products, store owners can identify the most efficient and reliable partners. This analysis helps build a strong and flexible supply chain, capable of efficiently meeting customer demands even during peak times. Utilizing data in inventory and supply chain management ensures smooth operations, reduces operational risks, and supports the sustainable growth of the store.
Common Challenges in Data Analysis and How to Overcome Them
Despite the immense benefits of store analytics, there are common challenges that store owners face when trying to extract full value from their data. These challenges range from difficulty in choosing and integrating the right tools to correctly interpreting data, and finally, to transforming insights into tangible actions. Recognizing these challenges and how to overcome them is crucial to ensure that your data analysis efforts are not in vain and genuinely contribute to your store's growth and improved performance. Challenges, though seemingly complex, are often opportunities for learning and development.
One of the most prominent challenges is the sheer volume of data generated daily, which can lead to feelings of overwhelm and difficulty in prioritizing. Store owners may find themselves drowning in numbers and charts without the ability to extract real meaning or determine next steps. Therefore, it is essential to adopt a structured and focused approach, starting by defining clear business objectives that analytics should achieve. This helps filter out noise and focus on the most important metrics for your business.
Another challenge is the lack of sufficient expertise in data analysis and interpretation. Not every store owner has a background in data science or statistics. However, with the intuitive tools provided by platforms like Salla, Zid, and Shopify, along with available educational resources, anyone can develop their analytical skills. If needed, seeking help from data analysis experts or consultants can be a wise investment that helps accelerate the learning process and ensure accurate and actionable insights are derived.
Choosing and Integrating the Right Tools
Many store owners face the challenge of selecting the appropriate analytical tools for their store, especially with a large number of options available in the market. Between built-in tools on platforms like Salla, Zid, and Shopify, and specialized third-party tools such as Google Analytics or conversion optimization tools, it can be difficult to determine what best suits the store's needs and budget. The choice of tools should be based on clear objectives, store size, and the desired level of analytical complexity.
It's not enough to just choose the right tools; they must also be effectively integrated to provide a complete and comprehensive picture of store performance. For example, integrating Google Analytics with Salla or Zid analytics can provide deeper insights into visitor behavior beyond just purchases. The challenge here lies in ensuring seamless data flow between different tools and avoiding data duplication or inconsistencies. The integration process must be thoughtful and carefully executed to ensure data accuracy and validity.
To overcome this challenge, it is advisable to start with the built-in tools provided by the platform (Salla, Zid, Shopify) due to their ease of use and full integration. Later, as the store grows and analytical needs increase, specialized external tools can be considered to address specific aspects such as user behavior analysis or SEO. The most important thing is to build a flexible and scalable analytical system that can adapt to changes in store needs without excessive complexity or prohibitive costs.
Understanding and Interpreting Data Correctly
Understanding and interpreting data correctly is a fundamental challenge, as merely possessing numbers does not necessarily mean the ability to derive accurate insights from them. Misinterpreting data can lead to poor business decisions, which can cost the store a lot of time and money. For example, a report might show that a particular product generates high sales, but a deeper dive into the data might reveal that this product is sold at significant discounts, reducing the overall profit margin, which doesn't necessarily reflect true success.
To overcome this challenge, store owners must develop a basic understanding of statistical concepts and how indicators relate to each other. It is also important to view data in its full context, avoiding drawing conclusions based on a single metric. For example, one should not focus solely on traffic numbers without considering the conversion rate or average order value, as high traffic may mean nothing if it doesn't convert into effective sales. This holistic understanding prevents falling into the trap of spurious correlations.
It is also advisable to utilize available online educational resources, specialized blogs, and even training courses to enhance data analysis skills. If the data is too complex or specialized insights are needed, consulting a data analysis expert can provide significant value. The goal is not to become a data scientist, but to be able to read the stories data tells your store and how you can use these stories to achieve the best possible results.
Taking Action Based on Analytics
The final, and most crucial, challenge is converting insights derived from analytics into practical, tangible actions. Collecting and analyzing data remains useless if it is not followed by real work that leads to improvements. Many store owners fall into the trap of continuously analyzing data without taking actual steps based on what they learn, leading to missed opportunities and repeated mistakes. There must be a clear action plan that starts with analysis and ends with implementation and evaluation.
To overcome this challenge, store owners must develop a clear action plan for every insight derived from analytics. For example, if data shows a high cart abandonment rate, potential reasons should be identified (e.g., complex checkout process), then a plan to address these reasons should be developed (e.g., simplifying checkout steps or adding more payment options). Responsibilities and timelines for each action must be defined to ensure effective implementation and continuous follow-up to evaluate results.
Furthermore, a culture of continuous experimentation and periodic improvement must be adopted. Not all data-driven decisions will be successful on the first try. Store owners must be prepared to conduct A/B tests, monitor the impact of changes, and adjust their strategies based on new results. This iterative process ensures that the store continuously evolves, becomes more efficient, and performs better over time. Converting analytics into action is the essence of smart e-commerce store management.
Conclusion: The Compass for Success in E-commerce
In conclusion, the importance of store analytics as a vital tool for making smart, informed decisions in the rapidly evolving world of e-commerce cannot be overstated. We have demonstrated that data is not just numbers; it is an invaluable source of insights that enable store owners to understand their customers, evaluate product performance, and enhance the effectiveness of their marketing campaigns. Whether you use Salla, Zid, or Shopify, the built-in analytical tools provide the strong foundation you need to build a strategy for sustainable growth and increased profitability.
The journey of transforming raw data into actionable insights may seem complex at first, but by focusing on key performance indicators, leveraging platform analytical capabilities, and intelligently addressing common challenges, any store owner can become a data-driven leader. From optimizing user experience and conversion rates to determining effective pricing strategies and efficiently managing inventory, analytics plays a pivotal role in every aspect of an online store.
Therefore, we invite you to embrace a culture of continuous analysis and ongoing learning. Make reviewing your store's analytics an integral part of your routine, and don't be afraid to experiment and adjust your strategies based on what the data reveals. The stores that succeed in the future are those that master the art of transforming data into smart decisions and effective actions, thereby securing a leading position in the competitive e-commerce market. Invest in understanding your data, and you will find your store growing and evolving in ways you never imagined.