In the fast-paced world of e-commerce, simply launching an online store is no longer enough to achieve desired success. With increasing competition and constantly changing consumer behavior, understanding what's happening within your store has become crucial for staying ahead. This is where store analytics come in; they are not just dry numbers and statistics, but your compass for a deep understanding of your store's performance, customer behavior, and hidden opportunities for profit growth. Whether you use Salla, Zid, or Shopify, the ability to read this data and translate it into actionable decisions is what distinguishes successful stores from others.
Neglecting store analytics is like sailing in a turbulent ocean without a map or compass; you might reach your destination by chance, but sustained success requires a clear vision and a robust strategy built on facts. In this comprehensive article, we will delve into the world of e-commerce store analytics, exploring key metrics, the tools available on platforms like Salla, Zid, and Shopify, and how to convert these numbers into effective strategies to boost your sales and enhance your profits. Don't just be a seller; be a smart analyst who leverages every available piece of information to their advantage.
Why Is Store Analytics Essential for Your Success?
Store analytics serves as the backbone of any successful e-commerce strategy, providing you with the insights needed to make informed decisions rather than relying on guesswork. Instead of assuming what your customers want or which products are most appealing, data offers definitive answers based on their actual behavior. This shift from conjecture to certainty reduces risks and increases the effectiveness of your marketing and operational efforts, positively impacting your store's overall profit margin.
By analyzing data, you can gain an unprecedented understanding of customer behavior, from how they arrive at your store and the pages they interact with, to the products they purchase or abandon in their shopping cart. This deep understanding allows you to personalize the shopping experience, offer more attractive deals, and optimize the entire customer journey. For example, you can discover the reason for cart abandonment and address it immediately.
Furthermore, store analytics helps you uncover hidden opportunities and challenges that might not be immediately obvious. You might discover a product performing exceptionally well in a particular geographical area, or notice a sudden drop in the conversion rate for a specific page, indicating a need for improvement. These insights enable you to respond quickly to market changes and continuously improve your store's performance, ensuring sustainable profit growth in the e-commerce landscape.
Traffic Metrics
Traffic metrics are the starting point for understanding your store's performance, as they tell you how effective your marketing efforts are in bringing potential customers to your store. Among the most important of these metrics are the number of visitors and page views. Unique visitors indicate your store's reach and appeal, while page views reflect how much these visitors interact with your content. Regularly monitoring these numbers helps you evaluate the success of your marketing campaigns.
In addition to the number of visitors, you should pay close attention to traffic sources. Do most of your visitors come from organic search, paid advertising, or social media platforms? Understanding these sources helps you allocate your marketing budget more effectively, focusing your efforts on channels that yield the best return on investment. You can refer to our article on SEO for Salla and Zid Stores: Dominating Search Results to improve your organic traffic.
Bounce Rate is another vital metric that shows the percentage of visitors who left your store after viewing only one page, without interacting with any other content. A high bounce rate might indicate that the landing page doesn't meet visitor expectations, the design is unattractive, or the page content is irrelevant. Improving the bounce rate requires a comprehensive review of the user experience.
User Behavior Metrics
After attracting visitors to your store, understanding their in-store behavior becomes the next step to increasing conversions. Key among these metrics is tracking the most visited pages, which tells you which products or categories receive the most attention. This information is invaluable for identifying popular products to focus on in your marketing campaigns, or for determining products that might need improvement in their display or description.
The Customer Journey is a complex and highly important metric, illustrating the steps a customer takes from entering the store until completing a purchase or leaving. Analyzing this journey helps you identify friction points or obstacles customers might encounter, such as difficult navigation or a complicated checkout process. By simplifying this path, you can significantly enhance the shopping experience.
Time on Site is another indicator of visitor engagement with your store. The more time visitors spend exploring your store, the higher their chances of finding what they're looking for and making a purchase. If the average time on site is low, it might suggest that your content isn't engaging enough or navigation is difficult. Working on improving these aspects can lead to increased interaction and thus a higher likelihood of conversion.
Sales & Conversion Metrics
Sales and conversion metrics represent the ultimate outcome of your efforts, measuring your store's effectiveness in turning visitors into paying customers. Conversion Rate is undoubtedly one of the most crucial metrics, representing the percentage of visitors who completed a purchase out of the total number of visitors. A high conversion rate means your store is effective, while a low rate indicates problems that need addressing. Improving this rate is the ultimate goal for any online store, and you can read more about Conversion Optimization: Boosting Your Salla and Zid Store Sales strategies.
Average Order Value (AOV) is another vital metric that shows the average amount a customer spends per purchase. Increasing this average means you're generating more revenue from each existing customer, without needing to increase customer count. This can be achieved through cross-selling and up-selling strategies, such as suggesting related products or attractive product bundles. Monitoring this metric helps you evaluate the effectiveness of these strategies.
Total sales revenue is the clearest indicator of your store's financial success, but it should be analyzed in conjunction with other metrics to understand the complete picture. For example, your revenue might be high, but if the average order value is very low, it could mean you're relying on a large number of small transactions. Understanding revenue from different sources helps you determine where to place your future investments and efforts.
Identifying best-selling and least-selling products gives you clear insight into your inventory performance. Popular products should receive special attention in terms of marketing and stock availability, while underperforming products might need re-evaluation, whether in terms of pricing, description, images, or even a decision to remove them from the store to avoid inventory buildup. This data enables you to make smart decisions regarding inventory management.
Abandoned Cart is a common problem in e-commerce, where customers add products to their shopping cart but do not complete the purchase. Tracking this metric is crucial because it indicates customers who were on the verge of converting. Analyzing the underlying reasons for cart abandonment can help you recover a significant portion of these lost sales by improving the process or launching Email Marketing: Boosting Your Salla and Zid Sales campaigns to target these customers.
Salla Analytics
Salla provides store owners with a comprehensive set of integrated analytics tools that make it easy to understand their store's performance. Through the dashboard, you can access a complete overview of your store's performance, including total sales, number of orders, average order value, and best-selling products. This dashboard is designed to be user-friendly and understandable, allowing you to gain quick and clear insights.
In addition to the overview, Salla offers detailed reports on various aspects of store performance. You can delve into sales reports by product, by time period, or even by source, helping you identify the most profitable products and peak sales times. It also provides customer reports, allowing you to understand who your most loyal customers are and their purchasing preferences.
To maximize Salla analytics, it is recommended to regularly check the reports section, customize filters to suit your needs, and compare performance across different time periods. For example, you can compare this month's sales to last month's to identify growth trends. Linking your store to Google Analytics also provides an additional layer of detailed analysis, especially concerning visitor behavior and traffic sources.
Zid Analytics
Zid is not much different from Salla in offering powerful analytical tools that help store owners track their progress and improve performance. Zid provides an intuitive dashboard that displays key statistics at a glance, such as total revenue, number of orders, visitor count, and most requested products. This basic data enables you to monitor your store's overall health and make quick decisions regarding any necessary improvements.
Zid stands out with its detailed reports covering multiple aspects. For example, Zid's sales reports allow you to analyze sales by product, category, or even by customer, helping you gain a deeper understanding of purchasing patterns and identify popular products. It also provides specific visitor reports, which let you know daily, weekly, and monthly visitor counts, and bounce rate.
To get the most out of Zid analytics, you should focus on reports that align with your business goals. If your goal is to increase average order value, focus on reports showing products most frequently purchased together. If you aim to improve user experience, study visitor reports and bounce rate. Proactively using this data allows you to adjust marketing strategies and optimize product offerings.
Shopify Analytics
Shopify, a leading global e-commerce platform, is known for providing advanced and highly customizable analytical tools. The Shopify dashboard offers a comprehensive overview of store performance, including real-time sales, visitors, average order value, and conversion rate. This overview allows you to stay up-to-date with your store's performance and make immediate decisions when needed.
Shopify features a wide range of detailed reports covering every aspect of your store. From sales reports by product, channel, or even by discount used, to visitor behavior reports that show you the pages they visit, their journey within the store, and bounce rates. It also provides financial reports to help you track profits and losses, and customer acquisition reports.
In addition to its built-in tools, Shopify allows seamless integration with external analytics tools like Google Analytics, which provides more detailed behavioral analysis of visitors. This integration enhances your ability to understand overall performance and accurately identify strengths and weaknesses. To choose the most suitable platform for your store, you can refer to our article on Salla, Zid, and Shopify: Which is Best for Your Store? which helps you make an informed decision.
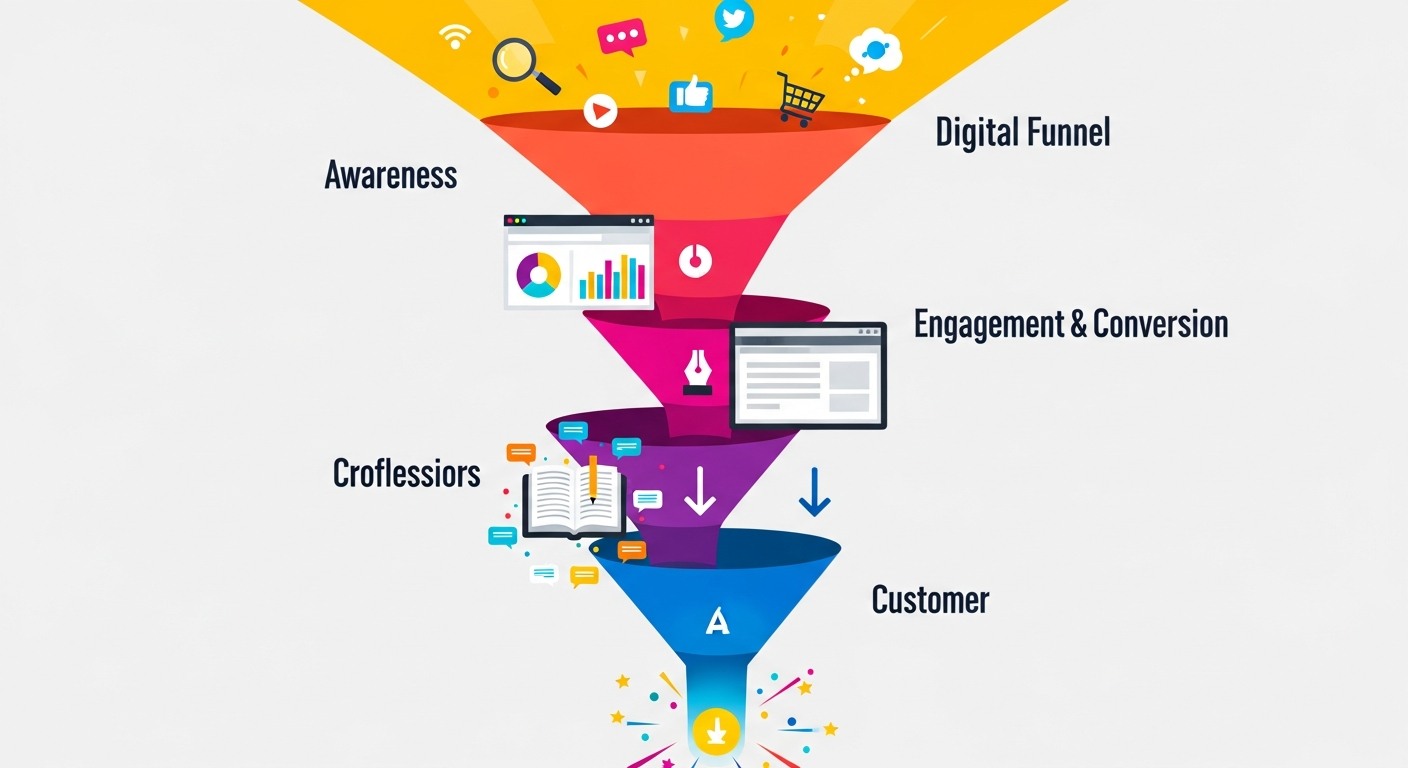
Improving User Experience (UX)
Reading data alone is not enough; the true value lies in the ability to translate these insights into practical actions. One of the most important areas for improvement is User Experience (UX). If your analytics show a high bounce rate on certain pages, or customers abandoning their carts at a specific step, this is a clear indication of the need to simplify the purchase process and improve page design.
This might involve reducing the number of checkout steps, improving website loading speed, or making navigation easier and more intuitive. Customers expect a smooth and convenient experience regardless of the device they use. All these data-driven adjustments can significantly increase the conversion rate, enhancing their loyalty and increasing the likelihood of completing purchases.
Analyzing heatmaps and session recordings—if available through additional tools—can also reveal how users actually interact with page elements. Are they clicking on non-clickable elements? Are they struggling to find the "add to cart" button? This visual information alongside numerical data provides a complete picture that helps you make precise and effective adjustments.
Effective Customer Targeting
Store analytics empowers you to understand who your customers are, what they buy, and how they interact with your store, enabling you to target them more effectively. When you know the most popular products among a specific age group, or products customers tend to buy together, you can design personalized marketing campaigns that speak directly to their interests and needs.
Using demographic and geographical data, you can identify the areas where your most valuable customers reside and tailor your advertisements to those regions. For instance, if you sell winter products and notice high demand in certain cold-weather cities, you can concentrate your advertising campaigns there. This type of precise targeting reduces marketing budget waste.
Analytics can also help you segment your customer base based on their purchasing behavior, such as new customers, repeat customers, high-value customers, or lapsed customers. For each segment, you can develop different marketing strategies, such as offering discounts to new customers, rewards for repeat buyers, or re-engagement messages for inactive customers. This personalization significantly boosts the efficiency of your marketing efforts.
Inventory Optimization and Product Management
Analytical data is a powerful tool for improving inventory management and product planning. By tracking best-selling and least-selling products, you can make informed decisions about inventory levels, avoiding stockouts for popular items or overstocking slow-moving products. This not only reduces costs but also ensures customer satisfaction.
If your analytics show a particular product receiving high page visits but not enough sales, it might indicate an issue with the product description, images, or pricing. In this case, you can experiment with optimizing these elements and monitoring their impact on the conversion rate. Conversely, if a product is performing exceptionally well, you might consider offering complementary products or expanding within the same category.
Analytics can also help you determine the optimal timing for launching new products or running promotional offers. By studying seasonal sales patterns and trends, you can identify periods of increased demand for certain products and capitalize on these opportunities. Data-driven effective inventory management ensures you are always ready to meet market demands and achieve maximum efficiency and profitability.
Optimizing Pricing Strategies
Store analytics plays a crucial role in formulating effective pricing strategies that maximize profits without negatively impacting sales. By analyzing sales data, average order value, and even competitor data, you can identify optimal price points for your products. You might discover that a slight price reduction for a specific product leads to a significant increase in overall sales volume and thus higher profits.
Analytics can also reveal customer price sensitivity for different products. For example, customers might be more sensitive to the price of essential daily products, while being less sensitive to the price of specialized or unique items. This understanding allows you to implement flexible pricing strategies, such as dynamic pricing, targeted discounts, or creating product bundles that increase perceived value.
Monitoring how sales respond to price changes over time is vital. Conduct A/B tests on different product prices and carefully analyze the results to determine the most effective strategy. This continuous process of testing, analyzing, and adjusting ensures your prices always align with market demand and customer expectations, leading to increased revenue and profitability for your store on Salla, Zid, or Shopify.
Reducing Abandoned Carts
Abandoned carts are one of the biggest challenges facing e-commerce stores, but store analytics provides you with the necessary tools to effectively address this issue. By tracking these carts, you can identify the most common products in abandoned carts, the steps at which customers stop in the checkout process, and the potential reasons for abandonment.
Once the reasons are identified, you can take corrective actions. For example, if unexpected shipping costs are the primary reason, you can display shipping costs early and clearly, or offer free shipping above a certain amount. If customers find the checkout process too long, you can simplify it by reducing the number of steps or offering quick payment options.
In addition to structural improvements, you can use data to launch targeted campaigns to recover abandoned carts. Reminder emails can be sent to customers who left products in their carts, offering incentives such as a small discount or free shipping to encourage them to complete the purchase. These personalized campaigns, supported by accurate analytics, can recover a significant portion of lost sales.
In conclusion, the importance of store analytics for any e-commerce store aspiring to growth and profitability cannot be overstated. It is not just an added feature but an absolute necessity in today's e-commerce landscape. Whether you manage your store on Salla, Zid, or Shopify, the ability to collect, analyze, and convert data into actionable decisions is what will set your store on the path to sustainable success. From understanding visitor behavior to optimizing the purchase path, every aspect of your business can be enhanced through the lens of analytics.
Always remember that data is a latent power waiting to be discovered and utilized. Don't let numbers intimidate you; instead, make them your strongest ally. Start by monitoring basic metrics, then gradually delve into details. Use the tools available on your platform, and don't hesitate to integrate them with external tools for deeper insights. Most importantly, make analysis an integral part of your daily or weekly routine, as small, continuous, data-driven changes can lead to tremendous long-term results.
Building a successful online store is not just about great products or attractive design; it's also about the intelligence in understanding the market and customers. Invest your time and effort in learning how to read your store's data and applying what you learn, and you will find your profits growing steadily. Let store analytics be your primary driver towards achieving your goals in the opportunity-rich world of e-commerce.