


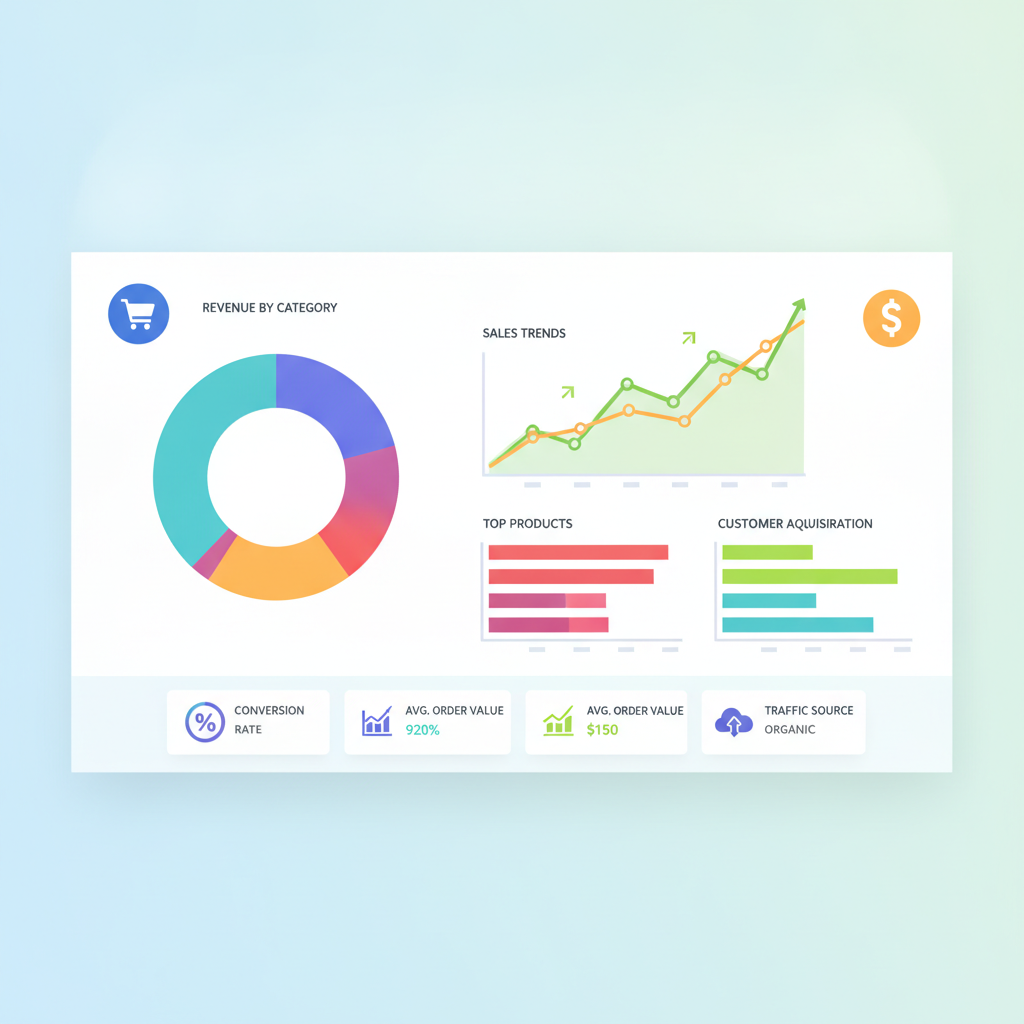
In the rapidly evolving world of e-commerce, merely launching an online store is no longer sufficient to achieve sustained success and profitability. The key to outperforming competitors and ensuring growth lies in a deep understanding of your store's performance, which is only attainable through accurate and comprehensive data analytics. Whether you are using Salla, Zid, or even Shopify, the ability to read numbers and transform them into strategic decisions is the real competitive advantage that separates thriving stores from those struggling to survive.
This article aims to be your comprehensive guide to understanding how to utilize your e-commerce store's analytics, with a specific focus on the tools and reports available in Salla and Zid platforms, alongside references to Shopify as a global benchmark. We will delve into the Key Performance Indicators (KPIs) you should track, and how to interpret this data to take practical actions that directly contribute to increasing your profits. We will provide actionable tips and real-world examples to help you convert raw data into valuable insights, enabling you to optimize every aspect of your store, from user experience to marketing and sales strategies.

The Importance of E-commerce Store Analytics in Boosting Profits
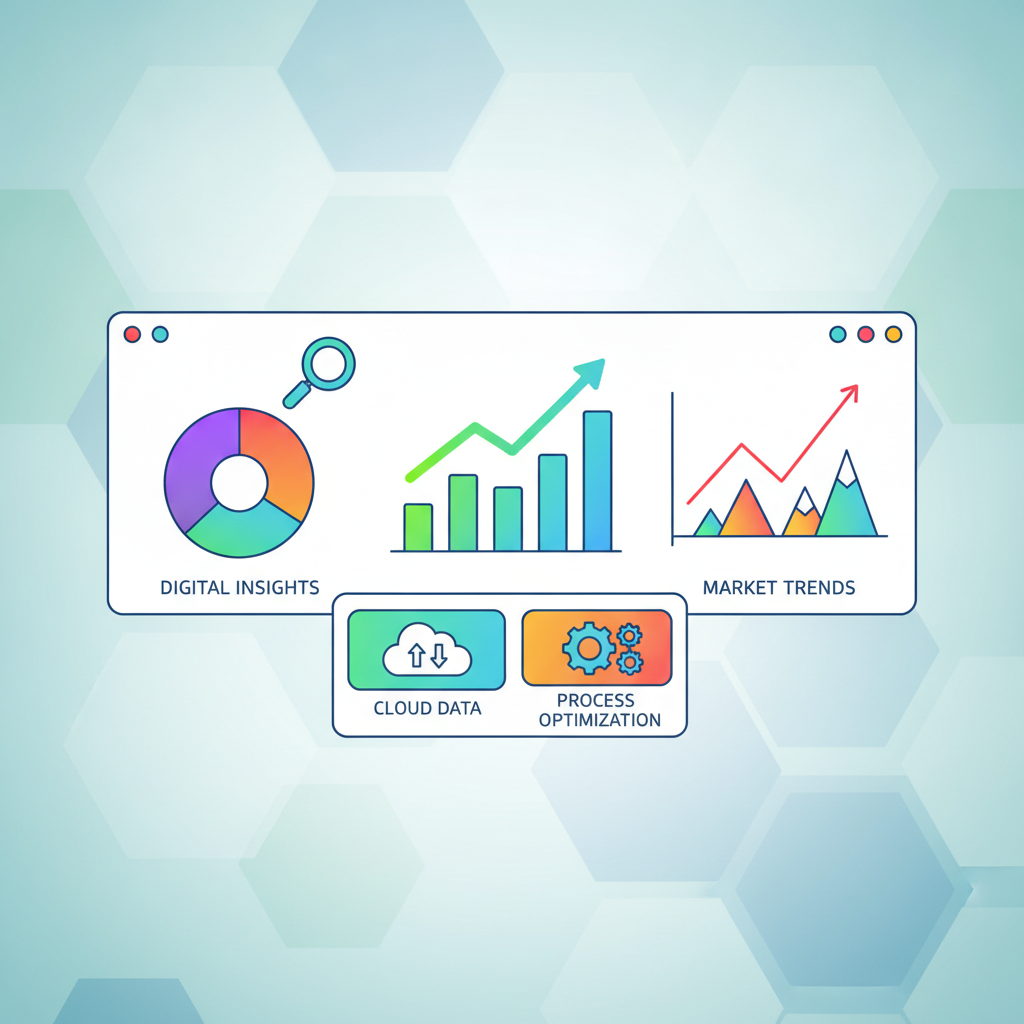
E-commerce store analytics serve as the compass guiding your business through the vast ocean of online commerce. Without it, your decisions would be based on guesswork and intuition rather than concrete facts and figures. A precise understanding of customer behavior, product performance, marketing campaign effectiveness, and operational efficiency empowers you to make informed decisions that enhance spending efficiency and increase your return on investment. When you can identify best-selling products, frequently visited pages, or even the points where customers abandon their purchasing journey, you gain an invaluable competitive edge that enables you to respond flexibly to changing market demands.
Effective analytics contribute to identifying hidden problems that might negatively impact your profits, such as a high cart abandonment rate, products that fail to attract customer interest, or even marketing channels that do not yield satisfactory returns. By regularly monitoring these indicators, you can intervene quickly to correct course and implement necessary improvements before problems escalate. For example, if you notice a sudden drop in your conversion rate, analytics can help you narrow down the issue to determine if it relates to product pages, the checkout process, or even a technical glitch in the store, saving you time and effort in searching for random solutions.
Furthermore, store analytics enable you to understand your target audience more deeply, including demographics, interests, and purchasing patterns. This information is invaluable for customizing your offers, refining your marketing messages, and developing new products that precisely meet your customers' needs and desires. Instead of launching generic marketing campaigns, you can target specific segments with personalized offers that increase the likelihood of purchase, thereby boosting profits. Investing in understanding your store's analytics is not a luxury but a strategic necessity for growth and prosperity in the highly competitive e-commerce market.
Key Performance Indicators (KPIs) You Should Track
To maximize the benefits of your store's analytics, you should focus on a set of Key Performance Indicators (KPIs) that comprehensively reflect the health and performance of your business. These indicators provide you with valuable insights into various aspects of your store, from sales and marketing to customer experience. It is crucial to select the KPIs most relevant to your business objectives and track them regularly to identify trends and opportunities for improvement. Without tracking these indicators, you would be like driving a car without a dashboard, unaware of your speed, fuel level, or any potential issues.
Among the most prominent of these indicators is the Conversion Rate, which measures the percentage of visitors who complete a purchase out of the total number of visitors. This KPI is critical as it reflects how effectively your store converts interest into actual sales. A low conversion rate might indicate problems with store design, ease of use, product pricing, or even store credibility. Improving this indicator, even by a small margin, can lead to a significant increase in profits without needing to increase visitor traffic. Closely related is the Average Order Value (AOV), which represents the average amount a customer spends per purchase. Increasing AOV can be achieved through upselling and cross-selling strategies, which are effective techniques to boost revenue from existing customers.
You should also monitor your Customer Acquisition Cost (CAC) and Customer Lifetime Value (CLTV). CAC measures the amount you spend to acquire a new customer, while CLTV measures the total expected revenue from a customer throughout their relationship with your store. The relationship between these two indicators is crucial; if CLTV is significantly higher than CAC, it means your marketing strategies are profitable and sustainable. Conversely, if CAC approaches or exceeds CLTV, you may need to re-evaluate your marketing campaigns or look for ways to increase customer loyalty. Equally important is the Cart Abandonment Rate, which indicates the number of customers who add products to their cart but do not complete the purchase. This KPI is particularly painful as it represents potential lost revenue and requires careful analysis to identify underlying causes, such as unexpected shipping costs or a complex checkout process. To delve deeper into this aspect, you can read our article on Cart Abandonment Strategies: Recovering Customers in Salla and Zid. Finally, the Bounce Rate, which measures the percentage of visitors who leave your store after viewing only one page, can indicate that the page content is irrelevant or the store design is unappealing, necessitating immediate improvements.
Analytics Tools Available in Salla, Zid, and Shopify Platforms
Modern e-commerce platforms like Salla, Zid, and Shopify recognize the paramount importance of data analytics, and therefore each provides a suite of integrated tools and reports to help store owners understand their performance. While the depth and detail of these tools may vary from one platform to another, they all aim to equip you with essential information for making informed decisions. Understanding how to access and utilize these reports is the first step towards managing a successful data-driven store.
On the Salla platform, the dashboard offers a comprehensive overview of store performance. You can find detailed sales reports that allow you to track daily, weekly, and monthly revenues, as well as analyze sales by product, customer, and even payment method. Salla also provides reports on best-selling and least-selling products, helping you manage your inventory and identify products to focus on in your marketing campaigns. Additionally, you can review customer reports to understand their purchasing behavior and identify your most loyal customers. For instance, you can easily see the number of orders per customer and their average order value, which aids in building customer retention strategies. You can further leverage this data to understand Customer Retention: Strategies for Your Salla and Zid Store Growth.
As for the Zid platform, it also offers a robust set of integrated analytics tools within its control panel. Zid provides comprehensive performance reports covering sales, visitors, conversion rate, and average order value, allowing you to monitor your store's health at a glance. Zid's reports feature clear and easy-to-understand charts and graphs, making it simpler for store owners to interpret numbers and identify trends. Zid also offers financial reports to help track expenses and net revenues, and inventory reports that assist in efficiently managing stock levels and avoiding undesirable shortages or surpluses. These reports are essential for improving Inventory Management: Enhancing Efficiency in Salla and Zid. On the other hand, Shopify is a leader in analytics, providing a built-in Shopify Analytics dashboard that offers deep insights into sales, visitor behavior, traffic sources, and marketing campaign performance. Shopify also allows seamless integration with Google Analytics, opening the door to more detailed and flexible analytics, in addition to a large number of third-party apps in the Shopify App Store that significantly expand analytical capabilities.
How to Use Google Analytics to Enhance Your Analytics
While e-commerce platforms like Salla, Zid, and Shopify offer integrated analytics tools, Google Analytics (GA), especially the newer GA4 version, remains an indispensable tool for deepening your understanding of your store's performance. Google Analytics allows you to track user behavior across your store in more detail, monitor custom events, and provide deeper insights into the customer journey from the first visit to the completion of a purchase. Proper integration of Google Analytics with your store opens new avenues for analysis that built-in tools alone cannot provide, giving you a real competitive advantage.
To get started, you need to set up a Google Analytics 4 (GA4) account and link it to your store. This process involves adding a specific tracking code to all your store's pages. Most platforms like Shopify provide this directly within their settings, while in Salla and Zid, it might require using specific apps or plugins, or even adding the code manually in some cases. Once linked, you can begin tracking important events such as page views, add to cart, begin checkout, and purchase. GA4 focuses on an "event" model rather than the traditional "session" model, making it more flexible in tracking user interactions across different devices and providing a more accurate understanding of the multi-channel customer journey.
Using Google Analytics, you can create custom reports to answer specific questions about your store's performance. For example, you can track traffic sources to identify which marketing campaigns bring the most visitors and sales, or analyze your customers' demographics to understand who your primary customers are. GA4 also allows you to perform funnel analysis to identify points where customers abandon their purchasing journey, helping you optimize these points to increase your conversion rate. The ability to compare the performance of different products, campaigns, and pages in one place gives you a comprehensive view that empowers you to make data-driven decisions to effectively boost your store's profits.
Practical Strategies for Data Analysis and Converting it into Profit
Merely collecting data is not enough; the true value lies in the ability to analyze it and extract actionable insights that transform numbers into profits. This approach requires strategic thinking and effective use of available tools. Here, we will explore a set of practical strategies you can apply to your store's data in Salla, Zid, or Shopify to maximize your analytics' benefits and increase your revenue.
Analyzing Customer Behavior
Understanding your customers' behavior is the cornerstone of any successful strategy to increase profits. By analyzing how visitors interact with your store, you can identify patterns and preferences that help you improve the shopping experience and boost sales. Start by tracking the path customers take within your store: Which pages do they visit first? Which products do they view repeatedly? How long do they stay on each page? This data can reveal their interests and help you optimize store design and content distribution in a way that enhances the purchasing journey. For example, if you find that customers spend a long time browsing a specific category, this could be an opportunity to introduce more products in that category or highlight it more prominently on the homepage.

Customer behavior analysis also helps in identifying popular products and those that receive little attention. On platforms like Salla and Zid, you can easily access reports on best-selling and most-visited products. Use this information to refine your marketing and promotional strategies: focus on trending products in your advertising campaigns, and investigate the reasons for the poor performance of other products. Can the product description be improved? Are the images unappealing? Is the price uncompetitive? These questions can lead to significant improvements. Also, don't forget to analyze customer data itself, such as demographics, purchase history, and visit frequency. This information enables you to segment your customers and offer personalized deals to each segment, enhancing their loyalty and increasing the likelihood of repeat purchases. For detailed guidance on building customer loyalty, you can review our article on Customer Retention: Strategies for Your Salla and Zid Store Growth.
Finally, use customer behavior analytics to personalize the shopping experience. For example, if a customer always buys from a specific category, you can display similar or related products on their future visits. Personalization can also include targeted email messages based on browsing or purchase history. These strategies not only increase conversion rates but also enhance customer satisfaction and loyalty to your store, leading to a higher customer lifetime value in the long run. Personalization is key to success in modern e-commerce, and data is the fuel that powers its engine.
Conversion Rate Optimization (CRO)
Conversion Rate Optimization (CRO) is a systematic process of increasing the percentage of website visitors who take a desired action, such as making a purchase, without necessarily increasing the amount of traffic to the site. It focuses on understanding how users interact with your site and identifying obstacles that prevent them from completing desired actions. Optimizing your conversion rate can have a tremendous impact on your profits, as you can generate more sales from the same amount of existing traffic.
To achieve effective CRO, start by analyzing your conversion funnel to identify points where customers drop off. On platforms like Salla, Zid, and Shopify, you can track the customer journey from the product page to the shopping cart and then to the checkout page. If you notice a high drop-off rate at a certain stage, investigate the potential causes. Is the checkout process too complicated? Are there unexpected shipping costs? Are payment options limited? For example, if the cart abandonment rate is high, you might need to simplify the checkout process, display shipping costs earlier, or offer more payment options. You can benefit from our article discussing Cart Abandonment Strategies: Recovering Customers in Salla and Zid for detailed solutions.
Other CRO strategies include optimizing product pages, where product descriptions should be clear and convincing, images high-quality, and "Add to Cart" buttons prominent and distinct. Also, A/B testing can be a powerful tool to test different elements on your store, such as page titles, button colors, or store layouts, to determine which performs best. By testing small changes and monitoring their impact on the conversion rate, you can gradually and continuously improve your store. Remember that CRO is an ongoing process that requires continuous monitoring, analysis, and experimentation to achieve the best results.
Inventory and Product Management
Effective inventory management is a critical component of profitability, and store analytics play a pivotal role in optimizing it. By tracking product performance and inventory data, you can avoid common problems such as stockouts or accumulation of slow-moving items (dead stock), both of which negatively impact your profits. Platforms like Salla, Zid, and Shopify provide inventory reports that allow you to monitor product levels, identify products that need reordering, and those that might need to be cleared. Regularly using these reports helps you maintain an optimal balance between supply and demand.
Start by analyzing sales reports to identify best-selling products and slow-moving products. You must ensure that best-selling products are always available in sufficient quantities to meet demand, as stockouts for these products can lead to significant lost sales and customer frustration. Conversely, slow-moving products can drain storage space and capital, and require special strategies to clear them, such as offering discounts or bundling them with other products. Historical performance analytics can help you forecast future product demand, enabling you to optimize restocking schedules and reduce the risks of stockouts or excessive accumulation.
Additionally, product analytics can help you refine your product assortment. By understanding which products your customers prefer, you can make informed decisions about new products to add or products to remove. You can also use analytics to identify opportunities for cross-selling or upselling by analyzing products that are frequently purchased together. For example, if customers who buy a smartphone also frequently buy a case and screen protector, you can bundle these products or display them as suggested items. For more details on enhancing inventory efficiency, you can refer to our article on Inventory Management: Enhancing Efficiency in Salla and Zid.
Challenges of Data Analysis and How to Overcome Them
Despite the immense benefits offered by e-commerce store analytics, the process of collecting, analyzing, and extracting insights from data is not without its challenges, especially for store owners who lack technical or analytical expertise. These challenges can hinder the ability to fully leverage available data, negatively impacting decision-making and the effectiveness of strategies. Recognizing these obstacles and developing clear plans to overcome them is crucial to ensuring that your data remains a source of strength and growth, rather than just an overwhelming pile of incomprehensible numbers.
Many store owners face a significant challenge in dealing with Data Overload. As a store grows, and marketing channels diversify, and the number of customers increases, vast amounts of data accumulate from various sources: the store's control panel (Salla, Zid, Shopify), Google Analytics, social media ad platforms, email marketing tools, and CRM systems. It can become very difficult to know where to start, or which data is most important to focus on to achieve specific goals. This overload can lead to analytical paralysis, where store owners hesitate to take any action for fear of missing important information or misinterpreting data.
In addition to data overload, Data Quality is another critical challenge. If the data you collect is inaccurate, incomplete, or contains errors, any insights you derive from it will be misleading, which could lead to making incorrect decisions that harm your business instead of helping it. Data quality issues can arise from errors in tracking code setup, incorrect analytics tool configurations, integration problems between different systems, or even inaccurate manual entries. Compounding this is the challenge of a Lack of Expertise, as not every store owner has the necessary background in data analysis or statistics, making it difficult for them to interpret complex reports or build effective analytical models. These combined challenges require a systematic and continuous approach to ensure maximum utilization of store analytics' power. Finally, the challenge of Integrating Multiple Data Sources often makes it difficult to link data from different systems (such as CRM, marketing tools, and store analytics) to get a unified customer view. To solve this, look for tools or solutions that allow data integration, or use spreadsheets to manually consolidate and analyze data uniformly. This comprehensive approach will give you a clearer picture of your overall business performance. You can also delve into the impact of Influencer Marketing: A Guide for Your Salla and Zid Store and how to track its results.
In conclusion, the importance of e-commerce store analytics in achieving sustainable success and growth for your business cannot be overstated. Whether you use Salla, Zid, or Shopify, the ability to collect, analyze, and extract actionable insights from data is the fundamental skill that distinguishes a thriving store from one facing difficulties. In this article, we have reviewed the Key Performance Indicators (KPIs) you should track, how to use the available tools on e-commerce platforms, and the role of Google Analytics in enhancing your analytical capabilities.
Remember that analytics are not just numbers; they are stories told by your customers and your products. They tell you what works and what doesn't, and where opportunities for improvement and growth lie. By applying the practical strategies we discussed, such as analyzing customer behavior, optimizing conversion rates, and efficiently managing inventory, you can transform these stories into strategic decisions that increase your profits and enhance customer loyalty. Do not be afraid to delve into the world of data; the deeper you go, the greater the potential you will discover for your store.
Start today by applying what you have learned. Dedicate regular time to review your reports, identify trends, and test new hypotheses. The journey towards a successful and profitable e-commerce store is a continuous one of learning and improvement. Make store analytics an integral part of your business routine, and you will see how numbers can draw a clear path towards a prosperous future in the world of e-commerce. Invest in understanding your data, and you will invest in your success.